ansibug
Debug Adapter
This library is a Python based implementation of the Debug Adapter Protocol (DAP) from Microsoft.
It is designed to create a universal debugger for Ansible playbooks that can be used by any client that implements DAP.
Currently the only tested client is with Visual Studio Code through the ansibug VSCode extension so this guide uses examples from that.
You can find this extension at but it can also be installed directly through the VSCode or VSCodium’s extension viewer:
There is a brief video demo that goes through some of the features of the debugger with Visual Studio Code.
During this preview period the behavior and functionality of the debugger may change based on user feedback. Any changes will be documented in the changelog as new releases are pushed out.
Any feedback should be provided through
- Issues for bugs
- Discussions to discuss current behaviour and proposed alternatives
Thanks to ScreenToGif which was used to create the gifs used in the documentation.
Protocol Details
The ansibug library is specific a debug adapter implementation for Ansible.
It is in charge is understanding the messages sent by the client (VSCode) and handling them inside Ansible.
To understand more about ansibug and how it fits into the landscape of DAP see protocol details.
How to Use
Installing ansibug by itself provides very little benefit as it is designed to be used with a DAP client like Visual Studio Code.
It is designed to be used in conjunction with a client like the ansibug extension in VSCode.
The first step is to install the ansibug Python library which can be done with the following:
python -m pip install ansibug
From there you can install the ansibug VSCode extension by searching for it in the Extensions tab.
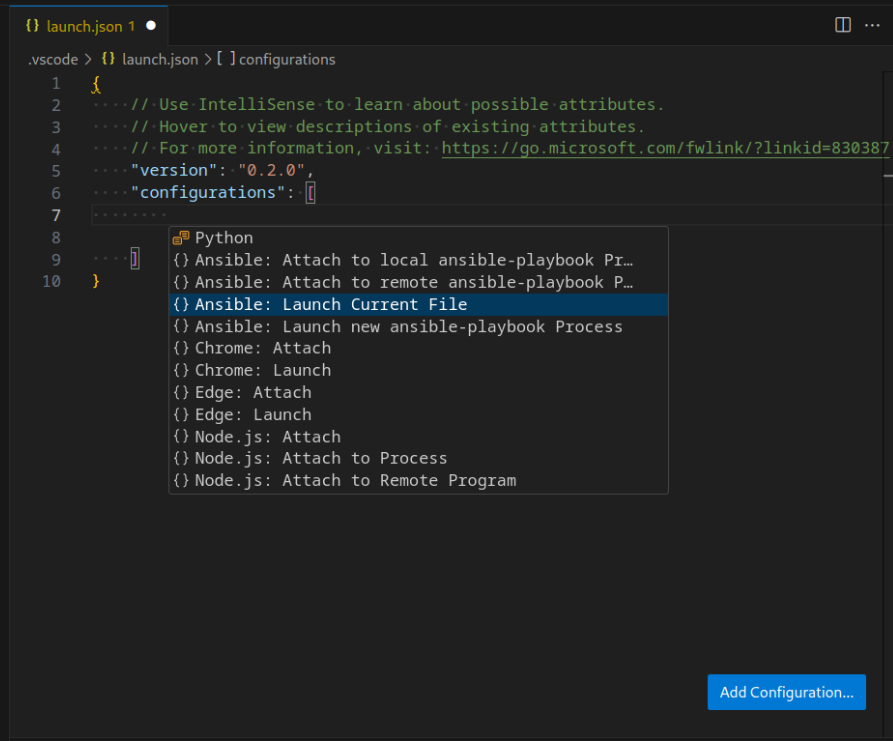
Once installed a playbook can be debugged by configuring a Launch Configuration.
There are four default samples you can use as a template, for example the Ansible: Launch Current File is a template that can be used to debug the current playbook file opened in the editor.
See Debug Configurations for more information on the launch vs attach types and the options that can be specified in the configuration json settings.
It is also possible to automatically launch the opened playbook file with F5 if launch.json does not exist or it contains no launch configurations.
Features
Using ansibug with a playbook can expose the following features:
| Feature | Notes |
|---|---|
| Breakpoints | Supports conditional breakpoints |
| Stepping | Stepping in/out/over on tasks |
| Multiple Hosts | A host is seen as a thread |
| Variables and Watching | Can get and set variables |
| Debug Evaluation | A repl console that can perform actions like templating |
The debug adapter works by using a custom strategy plugin to handle each task processing.
As this inherits the linear plugin it is not possible to use ansibug with a custom strategy.
Debug Configurations
There are 2 debug configurations supported by this adapter:
- Launch
- Attach
- By process id
- By address
The majority of the cases will use the Launch configuration as it is simpler to use and covers the main use cases of Ansible debugging.
Launch
The launch configuration will have the adapter launch a new ansible-playbook process and connect to it as it runs.
This will most likely be the more common configuration run by the adapter as it’s simple to configure and run.
The Ansible output will be shown in realtime by the client and the debug lifetime is tied to that process spawned.
A launch configuration supports the following arguments:
| Options | Required | Default | Info |
|---|---|---|---|
playbook |
Y | The playbook to debug | |
args |
Extra arguments for the ansible-playbook process |
||
cwd |
The working directory for the ansible-playbook process |
||
env |
Extra environment variables for the ansible-playbook process |
||
connectTimeout |
5.0 | The timeout, in seconds, to wait for the process to connect | |
pathMappings |
List of path mappings, see Path Mappings | ||
logFile |
The path to file to log the debug code. | ||
logLevel |
info | The logging level, can be info, debug, warning, error. |
Attach
The attach configuration is used to connect the debug client to an existing ansible-playbook process spawned by ansibug.
Attach is typically designed when trying to debug a playbook running on another host.
See Remote Debugging for more details on how to do this.
There are two common ways to specify the process to connect to:
- By process id
- Must be a process on the same host
- By address
- Can be a Unix Domain Socket path, or
- A TCP hostname and port
As the attach process requires the debugging components to be enabled, Ansible MUST be started through ansibug.
# Replace ... with the same arguments for ansible-playbook ...
python -m ansibug listen ...
By default the listening process will use the address uds:// to setup the listening socket.
This address is shorthand for creating a Unix Domain Socket under the temporary directory of the host, typically /tmp/ansibug-dap-*.
A custom address can be specified with --addr in the following formats:
| Address | Listen Only | Description |
|---|---|---|
uds:// |
Y | Creates a UDS at the temp directory specified by Python with a unique filename, typically /tmp/ansibug-dap-${UUID} |
uds://filename |
N | A UDS filename under the temporary directory specified by Python, typically /tmp |
uds:/tmp/filename |
N | A UDS at /tmp/filename |
uds:///tmp/filename |
N | Same as the above |
tcp:// |
Y | Binds to all IP interfaces with a random port |
tcp://:0 |
Y | Same as tcp://, specifying port 0 for any option will choose a random port |
tcp://:1234 |
Y | Binds to all IP interfaces with port 1234 |
tcp://hostname:1234 |
N | Connects to hostname with port 1234 |
tcp://192.168.1.1:1234 |
N | Connects to 192.168.1.1 with port 1234 |
tcp://[2001::1]:1234 |
N | Connects to the IPv6 address 2001::1 with port 1234 |
Entries with Listen Only can only be used for starting a listening process.
The entries that are not Listen Only are designed for connecting using the attach configuration address described below.
As the listening process starts it will display both the process id as well as the address it is listening on.
Ansibug listener has been configured for process PID 30011 on ‘uds:///tmp/ansibug-dap-45a1d94e-8bc3-4b79-93a2-3857e30f7ebf’
The process will then wait until the debug client connects to it to start the playbook unless --no-wait is specified.
The client debug configuration can either specify {"processId": 30011} or {"address": "tcp://localhost:34419"} as part of the attach arguments, one of these options must be set.
If using the processId, the debug client will lookup the address details under /tmp/ansibug-pid-$processId created by the process.
Once connected the process will resume with the debug client connected.
An attach configuration supports the following arguments:
| Options | Required | Default | Info |
|---|---|---|---|
processId |
The local process id to attach to | ||
address |
The socket address to attach to | ||
connectTimeout |
5.0 | The timeout, in seconds, to wait to attach to the process | |
useTls |
false | Wraps the socket with TLS, see TLS | |
tlsVerification |
verify | TLS verification settings, sett TLS | |
pathMappings |
List of path mappings, see Path Mappings |
Note: Specifying processId will override the value for address.
Logging
In case something goes wrong, it is possible to add logging for both the DA Server and Debuggee side.
To log the DA Server components the specify --log-file and optionally --log-level when calling python -m ansibug dap.
As this is a core component of how the debug client interacts with ansibug, actually setting these options are client specified.
To enable logging for the Debuggee side with a launch configuration the following launch arguments can be set:
{
  "logFile": "/tmp/ansibug-debuggee.log",
  "logLevel": "debug"
}
Setting the log for launch is done through the --log-file and --log-level args with python -m ansibug listen command.